Project · Original data · full stack
FlowTrack — a revenue operating instrument, built end to end
A synthetic B2B SaaS company built from scratch — the dataset, the PostgreSQL pipeline, the automated QA, and the five-page Power BI instrument its revenue leadership would actually run. Every layer is committed as readable source, and the report carries its own audit.
Measures verified
Every KPI on the instrument ties to a figure computed independently in SQL — the tie-out page ships inside the report itself.
A dashboard is easy to trust and easier to fake. This one carries its own audit: a validation page compares every measure against numbers derived outside the BI tool, and the whole artifact — data model, measures, report pages — is version-controlled text, not an opaque binary. The method is the exhibit.
The business question
FlowTrack is fictional on purpose. Portfolio work built on borrowed datasets converges on the same charts from the same Kaggle downloads; generating the company instead — 14 tables, roughly 388,000 rows, two fiscal years of a B2B SaaS built from zero to $69M ARR — means owning every definition end to end, because there is nobody else’s documentation to lean on.
The simulated ask is the one every revenue team actually has: leadership needs to run the business week to week — are we going to hit the number, which marketing dollars buy revenue, is the pipeline healthy, which customers are about to leave — not admire a retrospective. So the deliverable is an operating instrument, not a slide deck.
The instrument
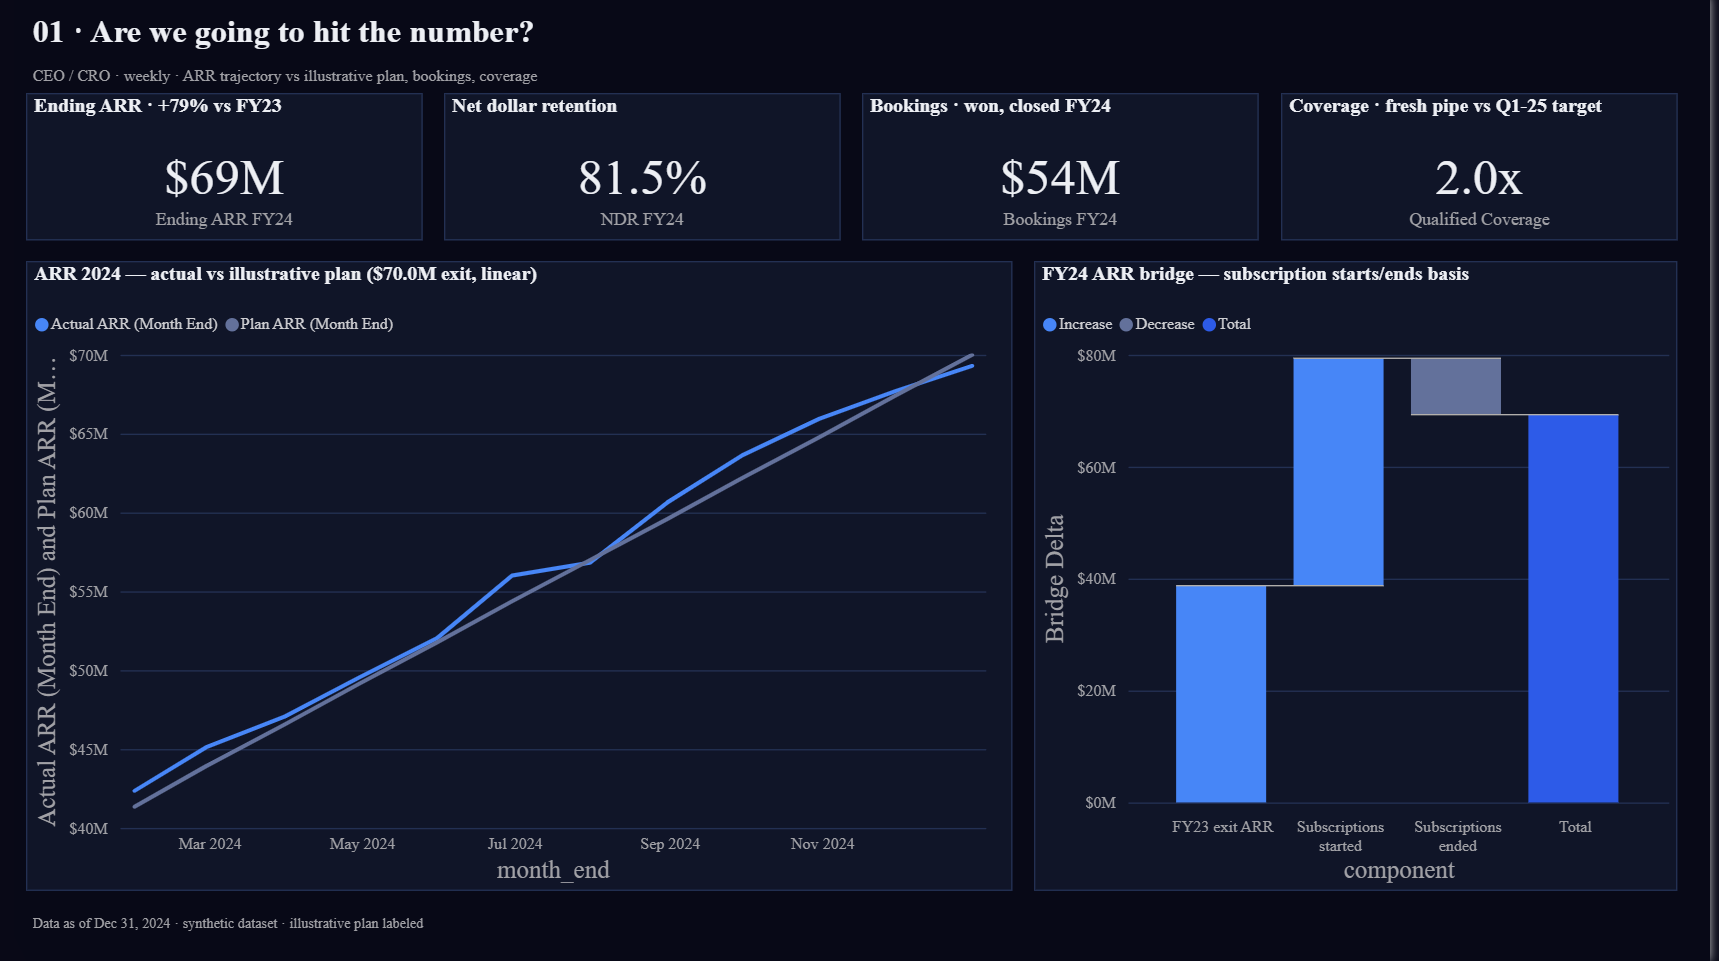
Five pages, each owned by a stakeholder and named by their recurring decision. The exec page tracks ARR against a plan line that is openly illustrative — the label is on the visual, because a dashboard without a “versus what” is a chart dump, and a fabricated plan presented as real would be worse.
Open the live report
Interactive, all five pages. Loads from Microsoft — nothing third-party runs on this page until you ask it to.
The report itself is public, so the screenshot above is not the only evidence on offer — the live instrument is one click away, all five pages navigable, filters and cross-highlighting intact.
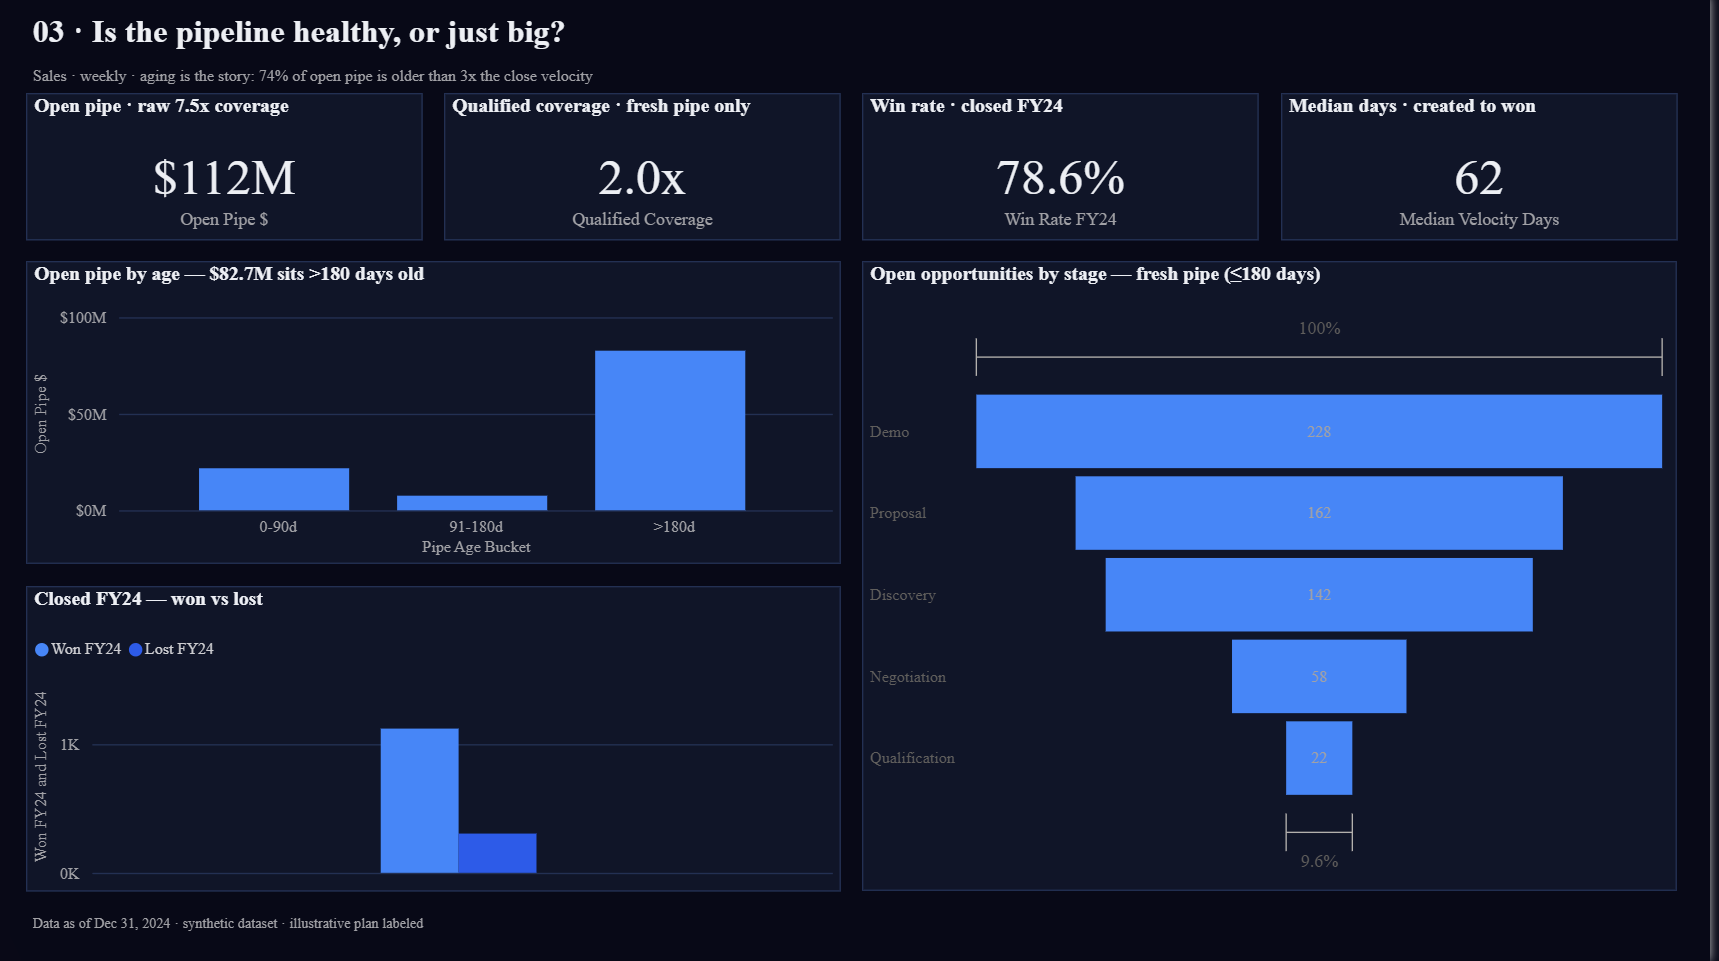
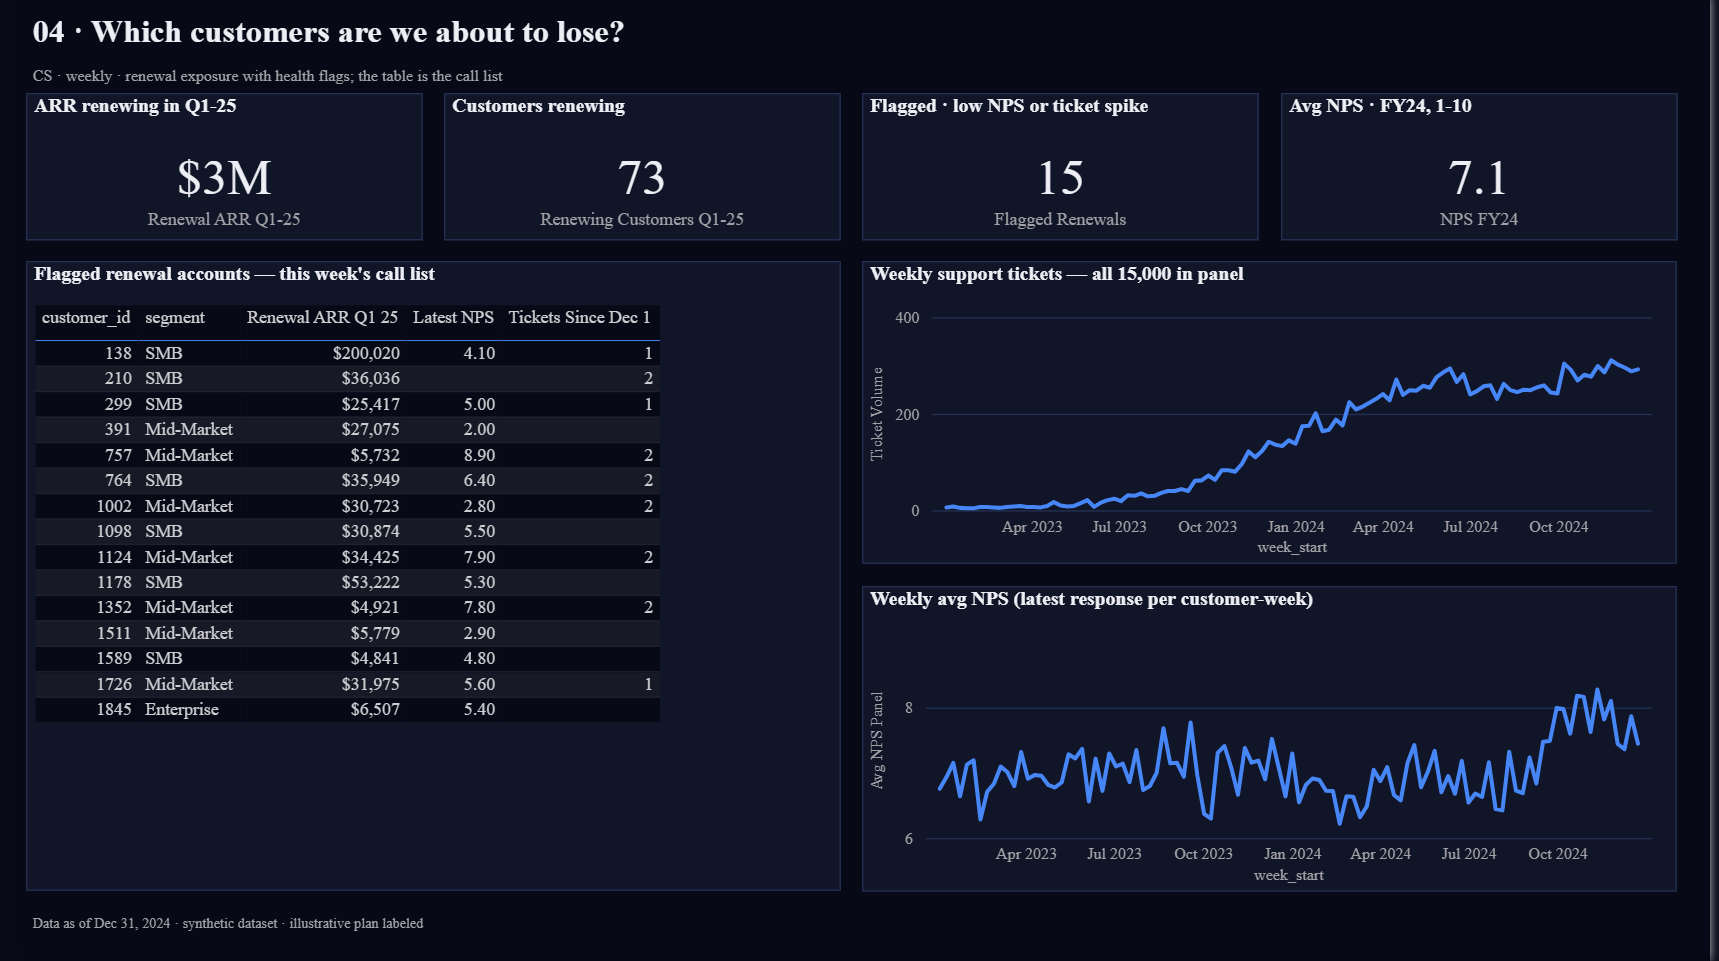
The pipeline page makes the argument most dashboards avoid: raw coverage says a flattering 7.5×, but 74% of the open pipeline is older than roughly three times the 62-day close velocity. Excluding it, qualified coverage is 2.0× — the honest number, and the page teaches the difference. The renewals page goes further: its product is a call list — thirteen weeks of renewal exposure crossed with health flags, naming the fifteen accounts worth a conversation this week.
Method
The pipeline is deliberately boring: fourteen CSVs load into PostgreSQL through committed DDL, four analytic views encode the business definitions, thirty pytest checks gate the data, Python extracts produce the KPI files, and the instrument imports those. A stranger reproduces the entire stack from the README in six steps.
The interesting part is what happened before the instrument was built. The repository was a year old, so it got audited the way a skeptical reviewer would audit it — and the audit found real defects: a case-sensitivity bug that had been silently zeroing pipeline bookings on the old dashboard, a join fan-out inflating churned ARR by roughly 40%, a week-alignment error between usage and ticket series, and 13,238 double-emitted activity rows. Every fix landed at the root cause, the pipeline was rerun end to end, and only then was the instrument built — as code, with the validation page as the final gate.
The old deck, wrong numbers and all, was retired in the same commit history that documents why.
Measured outcome
Automated data-quality tests — foreign-key integrity and volume bands — passing on every rebuild of the pipeline.
DAX measures, every one defined in version-controlled TMDL source rather than clicked together in a binary file.
Duplicate rows found and removed by the audit that preceded the rebuild — 16% of the activity log, double-emitted by the generator.
What the project demonstrates: the full path from nothing to an operating instrument — data modeling, pipeline construction, test discipline, and executive reporting — owned by one person, reproducible by a stranger in six steps. What it does not claim: the business results are synthetic and labeled as such everywhere they appear; the comparison plan on the exec page is illustrative and says so on the visual; the original data generators were not preserved, which the repo discloses rather than hides.
Appendix — method notes
Stack. PostgreSQL 17; Python for load, extracts, and the deep-dive report (psycopg2, pandas, pytest); Power BI Desktop in .pbip project format — the semantic model is TMDL text and the report pages are JSON, all diffable in the repository.
Provenance. The dataset is synthetic (Faker-based generators, produced once and not preserved); the committed CSVs are the canonical source, with the generation-time QA log kept in-repo. Figures on this page describe the artifact, not a real business.
Verification. Thirty pytest checks cover foreign-key integrity and realistic volume bands; a hidden validation page ties all twenty instrument measures to independently computed figures; the audit's findings and fixes are in the commit history, not summarized away.
Repository. github.com/thebryce15/flowtrack-revops-mvp — the README quick start stands up the database, tests, extracts, and instrument from a clean clone in six steps.