Case study 01 · Human operating control
The Report Said Non-Billable. I Asked Why.
A system label was being treated as an answer. I turned it into a question: ask the project leader, correct verified entries at the source, and repeat the control before every billing cycle. Average monthly non-billable hours for delivery staff on client projects were 63% lower across the measured post period—but the evidence also sets a hard boundary on what that result means.
Average monthly non-billable hours
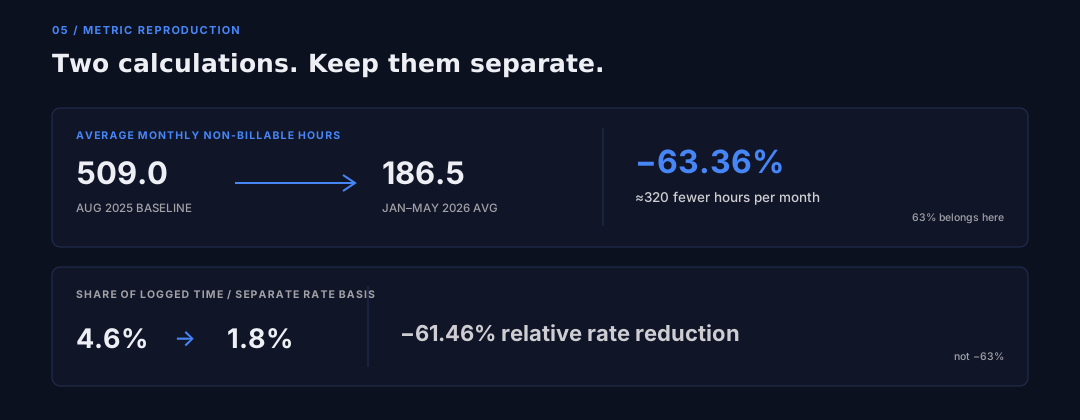
Delivery staff on client projects: 509.0 hours in the August 2025 baseline month versus 186.5 average monthly hours across January–May 2026—approximately 320 fewer hours per month. The share of logged time fell separately from 4.6% to 1.8%.
This is an observed classification difference, not a recovered-hours claim. The first compound framing failed because it mixed an hours reduction with a rate change. The corrected wording keeps those calculations separate and prohibits converting the result to invoiced hours, capacity, revenue, or dollars.
The overlooked question
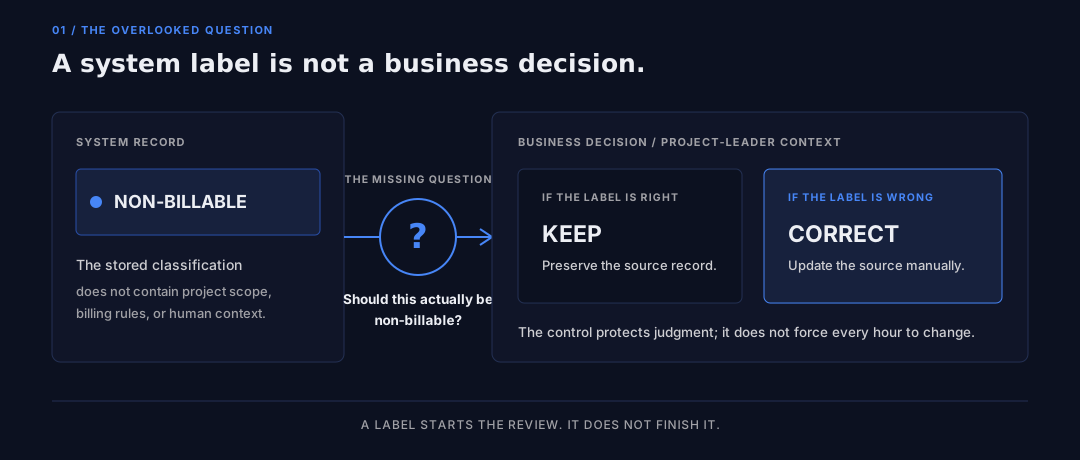
The report said the hours were non-billable. That was being treated as the end of the analysis. It should have been the beginning.
A system label cannot know whether a project meeting was out of scope, whether the wrong task was selected, or whether someone misunderstood the billing rule. The person leading the project often can. So before billing, I started asking a simple question: Should this actually be non-billable?
The human control loop
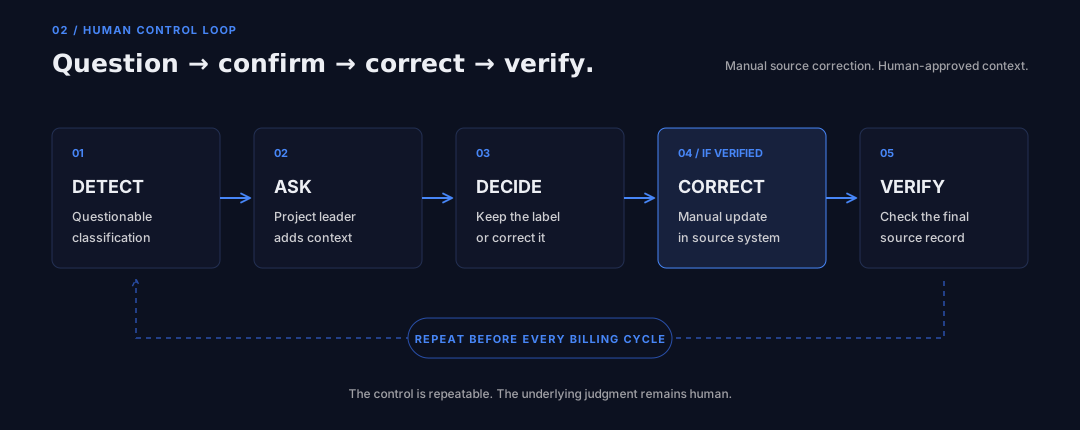
I reviewed non-billable time on client projects, surfaced the edge cases, and asked the relevant project leader for the missing context. If the classification was right, it stayed. If it was wrong, I corrected the verified entry manually in the source system and checked the result.
The point was not to force every hour to become billable. It was to stop accepting a default classification without the business judgment needed to defend it.
Taking operating ownership
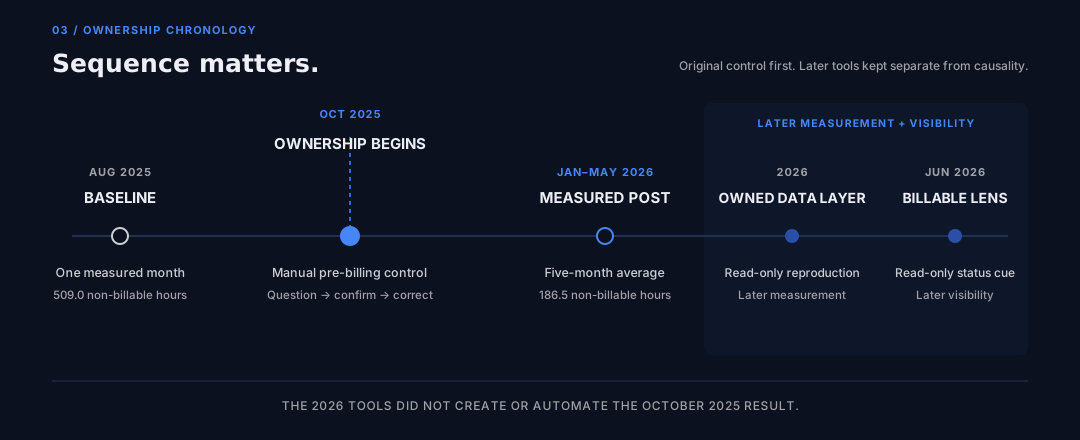
I took ownership beginning with the October 2025 billing cycle. The review became one control inside a larger manual operating cadence: pre-checks, invoice generation, PDF preparation, edge-case review, Outlook drafting, batch delivery, and closeout reconciliation.
Faster execution mattered, but so did repeatability. I retrained project leaders on timely, accurate timesheet approvals and made the same questions part of each monthly pass. The process moved from roughly three weeks to under one week.
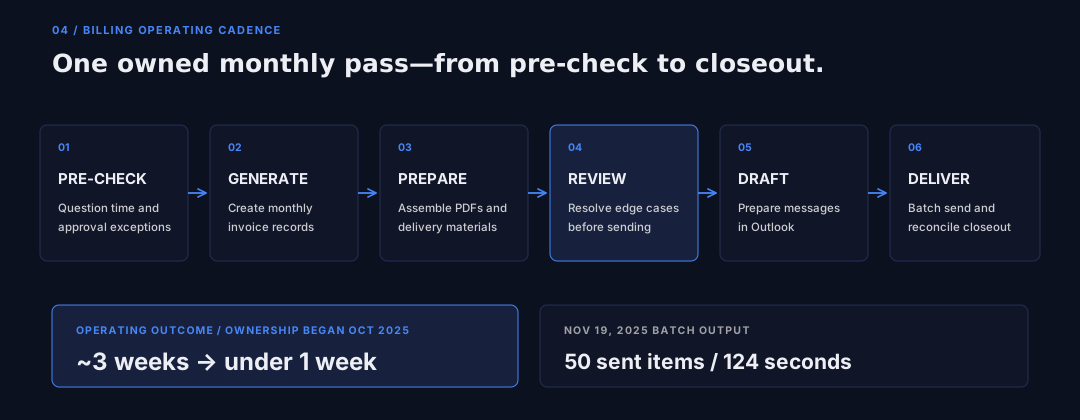
A surviving sent-output trail confirms 50 sent items within 124 seconds during the intended November 2025 run. That supports the batch-delivery step only. It does not establish total cycle duration or prove that a surviving script drafted or sent the messages.
The result—and the limit
Average monthly non-billable hours logged by delivery staff on client projects were 63% lower, from 509.0 in the August 2025 baseline month to 186.5 across the January–May 2026 post period—approximately 320 fewer hours per month. The share of logged time fell separately from 4.6% to 1.8%.
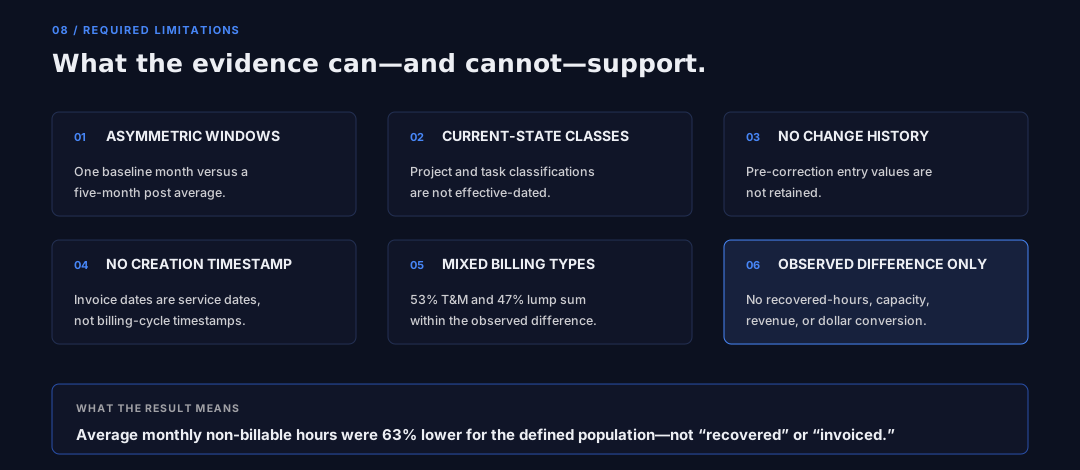
That is the claim the evidence supports. It does not support saying the difference was recovered, invoiced, converted to capacity, or converted to revenue.
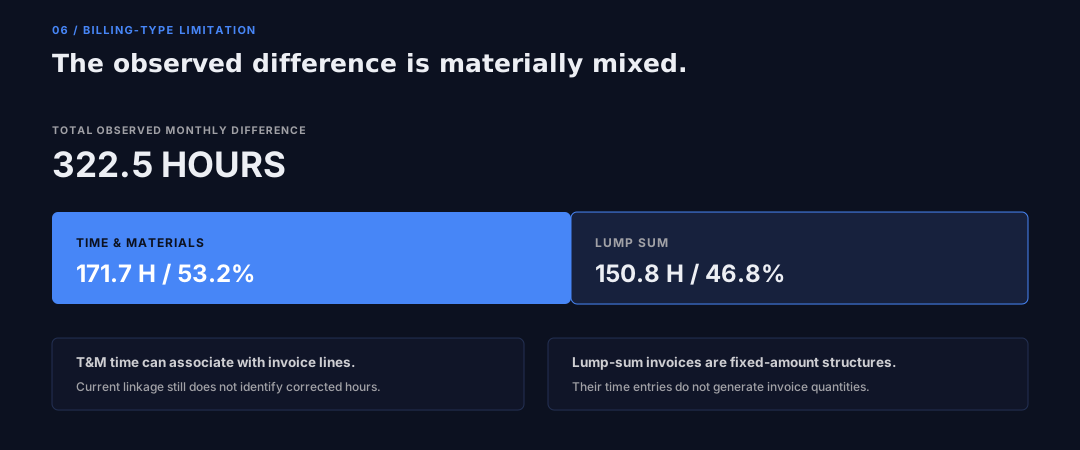
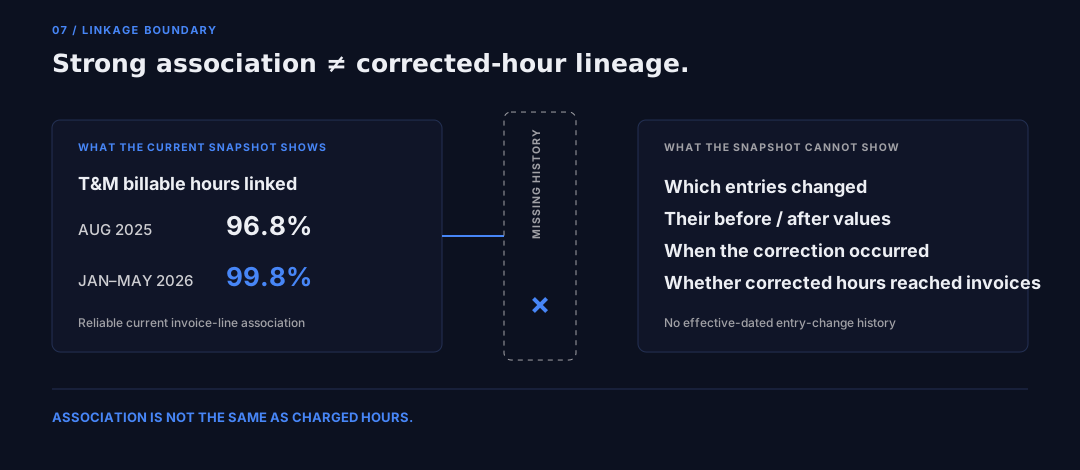
The boundary matters for two reasons. First, 46.8% of the observed difference occurred on lump-sum projects, whose time entries do not generate invoice quantities. Second, the current database strongly associates T&M billable hours with invoice lines, but it does not retain the pre-correction values needed to identify which entries changed.
The claim that failed
Every aggregate reproduced. The sentence did not.
The first compound headline joined 4.6% to 1.8% with −63%. The rate
fell 61%, while average monthly non-billable hours fell 63%. The sentence had
attached the right number to the wrong basis.
I kept the failure. The corrected claim attaches 63% to the hours comparison and reports the rate separately. A useful control should survive scrutiny; so should the story told about it.
Later controls, separated from causality
Later, I built read-only tooling to make the control easier to inspect and the metric easier to reproduce. The owned data layer preserves the source fields and re-runs the aggregate checks. Billable Lens, added in June 2026, restores a missing billable-status indicator in the ERP interface.
Those tools are later iterations. They did not create the October 2025 result, and they did not replace the project leader’s judgment or the manual source correction.
Measured outcome
Human verification before billing; verified corrections were entered manually in the source system.
Billing-cycle execution after I took ownership in October 2025, supported by separate process chronology.
Observed average monthly non-billable hours for the defined delivery-staff client-project population.
The durable result is a repeatable operating control with an auditable measurement boundary: question the classification, get the business context, correct only verified errors, and report the observed difference without turning association into causation.
Appendix — method notes
Metric. Non-billable hours are logged duration minus billable duration for the defined delivery-staff population on client projects.
Comparison. One fully measured baseline month, August 2025, versus the average of five post-period months, January–May 2026.
Verification. The aggregate hours and rate calculations were reproduced independently; the 63% headline belongs to hours, while the relative rate reduction is 61%.
Attribution. Current invoice linkage and current-state classifications cannot recreate entry-level before-and-after history, so the result remains an observed classification difference.